
How do I view campaign statistics?
Knowing and closely following the statistics is half the job when it comes to advertising in digital marketing! Therefore, analyze reports daily to ensure the success of your campaigns.
You can check the statistics as follows:
Your profile opens a basic overview of statistics where you can see some basic data.
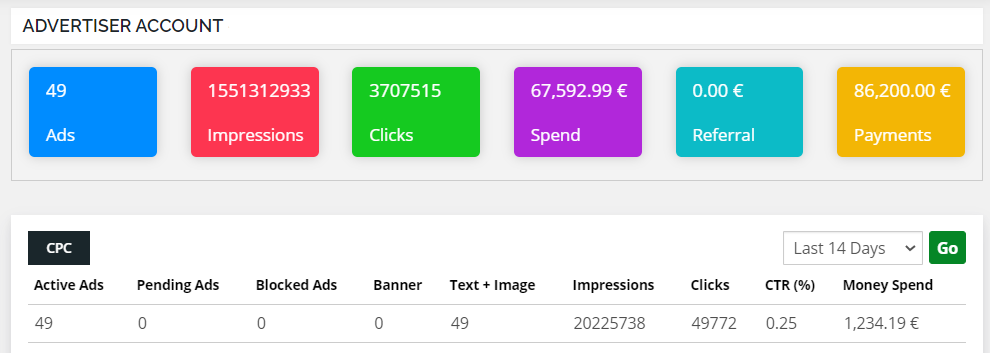
A chart opens where you can see the state for the current day:
- CPM Impressions – how many times have your campaigns been seen.
- CPC Clicks – how many users clicked on your ads.
- CTR (click-through rate) – percentage of users who clicked on ads relative to the total number of views (or so-called Impressions).
- CPC Spent – campaign budget spending in euros.
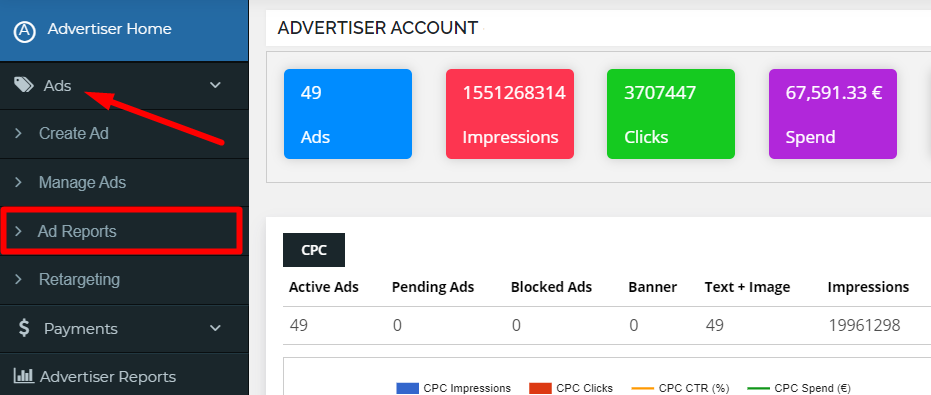
You can view a more detailed analysis by clicking ADS / AD REPORTS on the menu to the left.
A window with more detailed reports will open, where you will set certain parameters, depending on what statistics you want to see. You set everything in the drop-down menus at the top of the window.
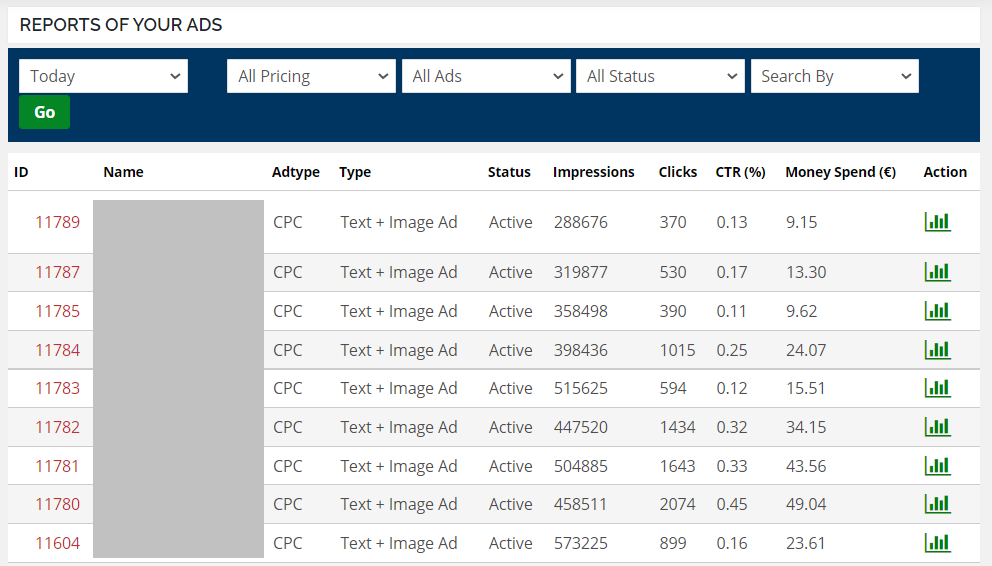
- The first falling menu – you determine the period during which you check the statistics: today, yesterday, the last 14 days, the last 30 days…
- There’s nothing to adjust on the second and third
- On the fourth, you can choose whether you want to see all campaigns, only active, paused campaigns, etc.
When you’re done setting up, click the green GO button and the platform will eject the statistics you need. You’ll get statistics for each campaign individually.
- ID – is the identification number of the campaign assigned by the platform.
- Name – the internal name of your campaign that you entered on Step 1 when you created it.
- Ad type – our platform offers only CPC form of advertising (payment per click) so this tag is always the same.
- Type – our platform has one type of advertising and that is text + image ad, so this tag is the same for everyone.
- Status — shows whether the ad is active, inactive, or paused.
- Impressions – how many times your campaign has been displayed.
- Clicks – how many times someone clicked on your campaign.
- CTR – is the percentage of users who clicked on ads relative to the number of views. For example, if 1,000 views are clicked 30 times on an ad, CTR is 0.30%.
- Money Spend – how much money you spent during the designated period on your campaign.
You can also view the report by clicking on a small green chart at the end of the table in the direction of each campaign. In the OVERALL REPORTS section, you will see the report for the entire current month.
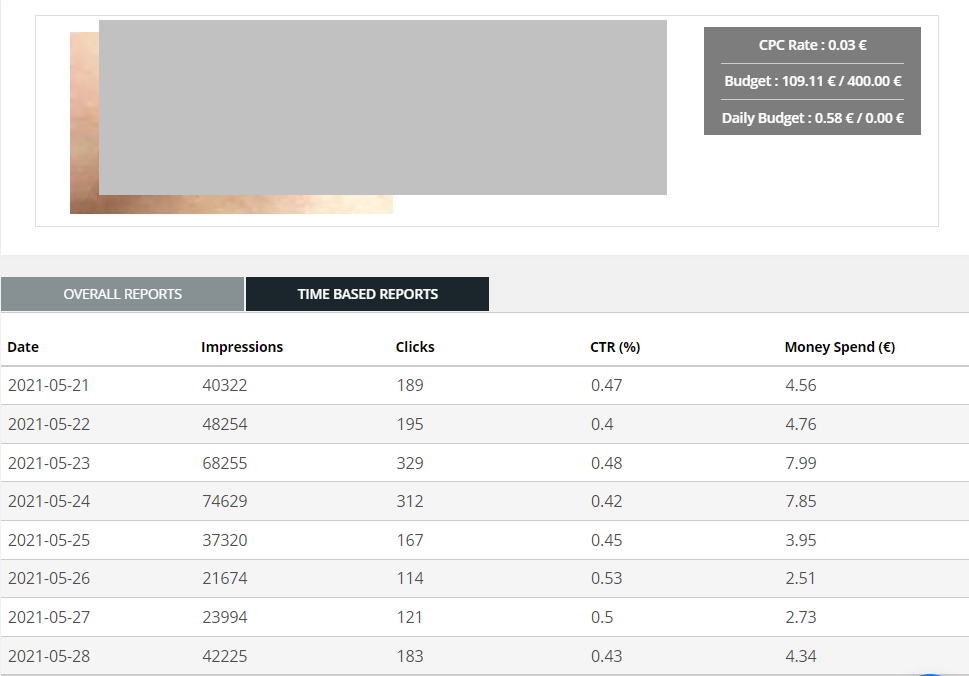
In TIME BASED REPORTS, you can view the report by the days of the current month.